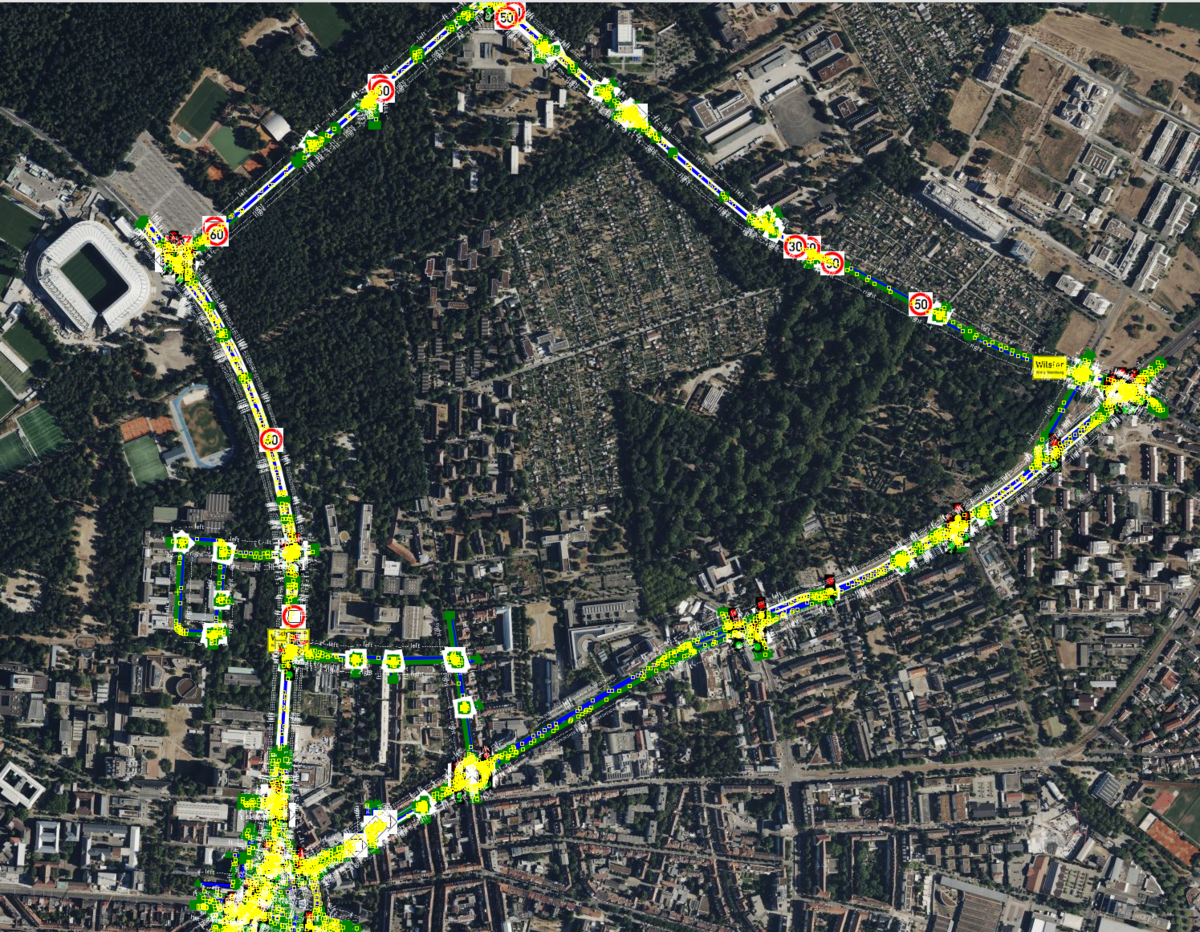
We regularly record our driving sessions to analyze and visualize our system performance.
A typical visualization shows:
-
Sensor Data: Camera feed, lidar data and object detections such as other cars
-
Lanelet2 HD Map and Planned Trajectory: a simple visualization of the HD map data, the given route and the planned trajectory (future positions and speeds) updated every 100ms.
-
Current Behaviour, Traffic Light State, AD Exits: Overlays showing current behaviour such as a planned lane change or stop for a red traffic light. Additionally we count how often the safety driver needed to take over
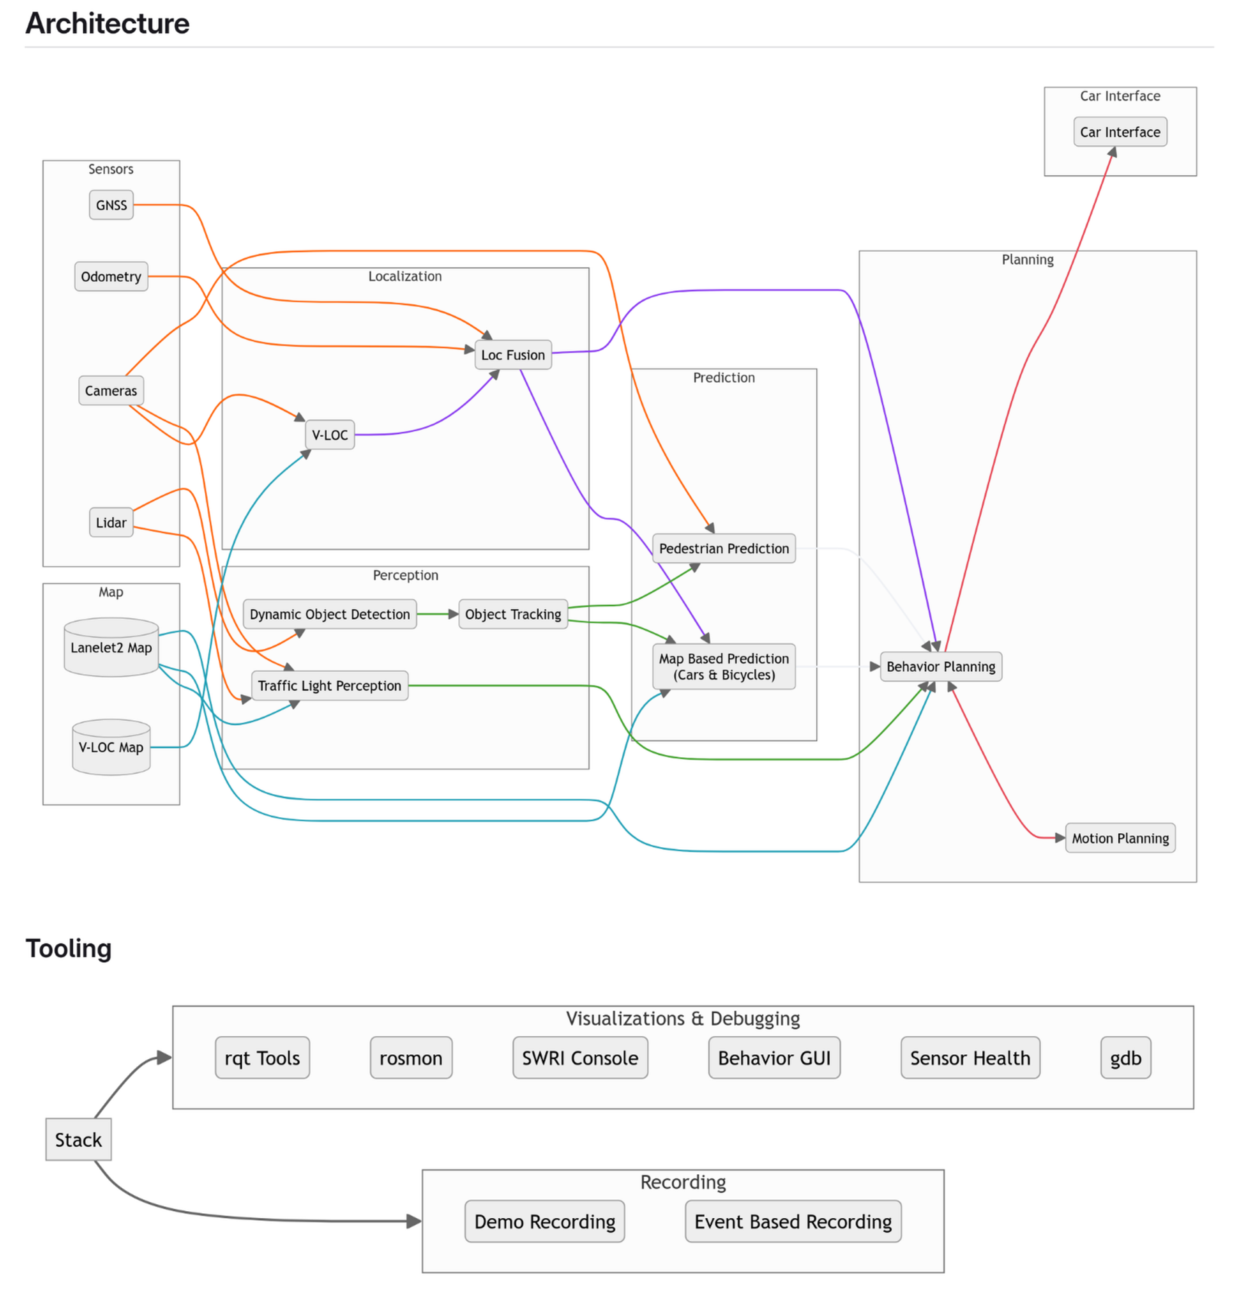
These recordings allow us to illustrate the real-time interaction between perception, prediction, and planning and to make the internal workings of the stack visible to both developers and observers.


